
Contents
Analyzing Race Results: What Your Splits Tell You
Learn how to analyze your race performance beyond the finish time. Decode your splits to understand pacing, identify weaknesses, and plan better future races.

What changed: Added a reproducible split-analysis workflow, two checked worked examples, and next-step links; removed unsupported pacing thresholds and causal diagnoses from pace and heart-rate patterns.
Quick Hits
- •Use official timing first, then compare it with watch data.
- •Normalize splits to equal distance before comparing pace.
- •Calculate the size and location of changes before proposing a cause.
- •Course, weather, congestion, stops, and GPS error can explain apparent pacing shifts.
- •Finish with one training or race-execution hypothesis you can test.
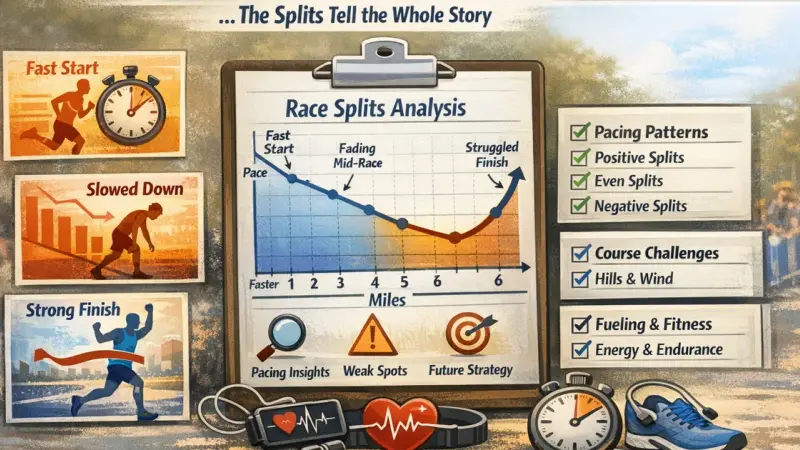
Analyzing Race Results
Your finish time is the outcome; splits show where the elapsed time accumulated. They do not automatically reveal fitness, fueling, or mental strength.
The Race-Analysis Workflow
| Step | Question | Output |
|---|---|---|
| 1. Verify | Which timing source and distance are reliable? | Official time plus known data caveats |
| 2. Normalize | Are the segments equal, or converted to pace? | Comparable min/km or min/mile values |
| 3. Describe | Where and by how much did pace change? | A neutral pacing pattern |
| 4. Add context | What changed on the course or in execution? | Plausible explanations, not a diagnosis |
| 5. Decide | What one change can the next race test? | A pacing, training, or logistics action |
Marathon pacing research finds multiple observed profiles and substantial effects from ability, sex, age, course, and other context. That evidence does not support labeling every positive split a failure or promising that a negative split is always fastest.
1. Verify the Record
Start with:
- official start, finish, and timing-mat results;
- watch elapsed time, not only moving time;
- the course's certified distance and known elevation profile;
- GPS distance, auto-pause, and manual-lap settings;
- any missed mat, stopped watch, tunnel, tree cover, or crowded turn.
If the watch records 10.18 km for a certified 10K, its kilometer alerts will not align perfectly with official course markers. Analyze each source for what it actually measured instead of forcing them to agree.
2. Normalize Unequal Splits
A 5 km segment and a 2.1 km finishing segment cannot be compared by raw time. Convert each to pace:
segment pace = segment time ÷ segment distance
When comparing race halves, report both the time difference and percentage relative to the first half. State the formula so future analyses are consistent.
Worked Example 1: 5K Kilometer Splits
| Kilometer | Split | Change from prior km | Observation |
|---|---|---|---|
| 1 | 4:40 | — | Fastest of first three |
| 2 | 4:41 | +0:01 | Essentially stable |
| 3 | 4:42 | +0:01 | Essentially stable |
| 4 | 4:55 | +0:13 | Largest slowdown |
| 5 | 4:48 | −0:07 | Partial rebound |
Total time is 23:46. The first three kilometers average 4:41/km; the last two average 4:51.5/km.
What the data supports: most of the pace loss occurred in kilometer four, followed by a faster final kilometer.
What it does not establish: whether the change came from the opening pace, a hill, wind, congestion, a turn, a brief stop, or fatigue. Check the course map, effort notes, and watch trace. If kilometer four was flat and unobstructed across repeated races, an overly aggressive opening becomes a stronger hypothesis to test.
Worked Example 2: 10K Halves
Suppose official 5K mats show:
- first 5K: 24:30;
- second 5K: 25:30;
- finish: 50:00.
The second half took 60 seconds longer. Relative to the first half:
60 seconds ÷ 1470 seconds = 4.1% longer
Call this a 60-second positive split. Do not call it a “4.1% fitness deficit” or claim the first half cost a specific amount. Next, compare elevation, wind, aid-station behavior, and the planned pacing strategy.
3. Add Context in Layers
Course and Conditions
Annotate climbs, descents, tight turns, surface changes, wind direction, temperature, rain, and altitude. Pace variation may be the correct execution on a variable course.
Race Logistics
Mark congestion, bathroom or shoe stops, aid-station slowing, missed turns, and start-corral position. These affect elapsed splits without describing physiological capacity.
Plan and Perception
Record the target effort, RPE by section, breathing, leg sensation, and when the race first felt unsustainable. Notes written soon after the race help prevent later reconstruction from the result alone.
Fuel and Hydration
Record what and when you consumed plus any gastrointestinal symptoms. A late slowdown does not diagnose glycogen depletion or dehydration. Use the observation to review the plan and, for longer events, practice a change in training rather than improvising on race day.
4. Use Heart Rate Carefully
Heart rate can add internal-effort context, but heat, hydration, caffeine, stress, medication, sensor contact, and wrist-device error all affect it.
Avoid rules such as “pace down + heart rate down = could have pushed harder.” A drop can reflect a sensor error, downhill section, deliberate backing off, a stop, or a real effort change. Inspect the trace and context before interpreting it.
5. Turn Analysis Into One Test
| Observation | Plausible next test |
|---|---|
| Repeated early surges above plan on flat courses | Use a conservative first-kilometer cap and compare execution |
| Pace loss aligns with sustained climbs | Practice effort-based hill pacing and set course-adjusted expectations |
| Aid stations create repeated abrupt slowdowns | Rehearse bottle or cup handling during appropriate long runs |
| Late pace fades across comparable races despite controlled starts | Review endurance preparation, recovery, and goal realism with the full training record |
| Watch and official distance disagree consistently | Use course markers/manual laps and analyze official segments |
For a deliberate faster finish, see negative-split strategy. For broader execution options, compare pacing strategies. If the result changes the next event choice, use the race-selection guide.
Save a Short Race Report
Keep five lines:
- Result and timing source.
- Split pattern in neutral language.
- Course and weather context.
- What went to plan and what did not.
- One change to test next time.
Use the Race Splits Calculator to create the next pacing plan, then keep the result and context together on your dashboard.
Key Takeaway
Describe first, explain second, act third. Reliable race analysis measures the pacing pattern, adds course and effort context, and produces one testable next step without claiming the splits reveal a single cause.
Frequently Asked Questions
What is a good split pattern?
Does a positive split prove I started too fast?
Should I trust official splits or my watch?
How soon should I analyze a race?
References
- https://pmc.ncbi.nlm.nih.gov/articles/PMC11400961/
- https://pubmed.ncbi.nlm.nih.gov/39281580/