
2026 running-shoe catalog research
2026 Running Shoe Trends: Price, Weight, Stack and Drop
A reproducible, partial-year analysis of the models represented in TrainingPlan.dev's runtime 2026 shoe catalog. Catalog facts are separated from editorial inference, and unsupported fields are disclosed instead of filled from prose.
By Bob Bodily · Published · Updated
- Cutoff:
- 2026-08-25
- Dataset:
- 2026-08-25.852db9c17f51
- Report:
- v1.2
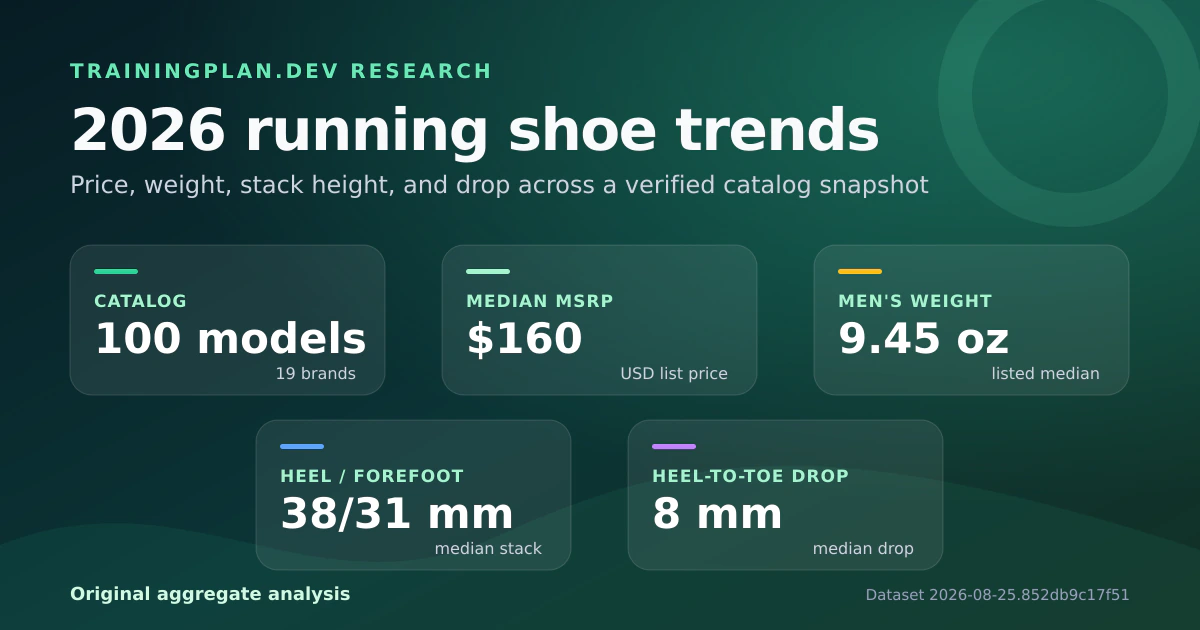
Snapshot
Models
100
Brands
19
Median MSRP
$160
Median geometry
38/31 mm
Findings, with claim type visible
Catalog fact
Summer releases shifted toward lower list prices
Median MSRP declined from $170 among 41 January–February releases to $150 among 33 June–July releases. The share priced at $180 or more fell from 34.1% to 21.2%.
Basis: Complete structured release month and MSRP fields; the June–July cohort is represented through the August 25 cutoff.
Editorial inference
More stack did not require more premium pricing
The high-stack share rose from 31.7% in the early cohort to 42.4% in summer-to-date even as the premium-price share fell. This suggests that 40 mm-plus geometry spread into less expensive launches within this catalog.
Basis: Inference from release-cohort MSRP and heel-stack fields; price and geometry do not measure ride quality or value.
Catalog fact
Specialist releases clustered early in the calendar
9 of 16 racing-tagged models and 12 of 18 trail-surface models in the snapshot were released in January or February.
Basis: Complete structured release month, category, and surface fields; the catalog is not a global release census.
Catalog fact
The snapshot is dominated by road and daily-trainer entries
75 of 100 models are classified as road shoes, and 60 carry the multi-label daily-trainer tag.
Basis: Complete structured surface and category fields across the runtime catalog.
Catalog fact
Racing-tagged models are lighter and more expensive in this snapshot
16 racing-tagged models have median MSRP $250 and median listed men's weight 7.25 oz, versus $150 and 9.5 oz for 60 daily-trainer-tagged models.
Basis: Complete MSRP and listed weight fields; category tags overlap and results are not sales-weighted.
Editorial inference
Race-day positioning is associated with a price-and-weight tradeoff
Within this catalog, the racing label is associated with lower listed weight and higher MSRP than the daily-trainer label. This is a cross-sectional association, not evidence that price causes performance.
Basis: Inference from the catalog-fact medians above; no performance outcome is measured.
Catalog fact
Long-run and recovery tags contain higher median heel stacks
The all-model median heel stack is 38 mm, compared with 41 mm for long-run-tagged models and 41.5 mm for recovery-tagged models.
Basis: Complete stack fields across the catalog; category tags overlap.
Editorial inference
Higher-stack geometry clusters around distance and recovery labels
The category medians suggest that higher heel stacks are more common among long-run and recovery labels in this snapshot. Stack alone does not establish comfort, stability, injury benefit, or ride quality.
Basis: Inference from complete catalog stack and category fields; experiential and health outcomes were not collected.
Catalog fact
Eight millimeters is the most common exact drop value
41 models list an 8 mm drop, while 15 list 4 mm or less.
Basis: Complete structured heel-to-toe drop across all runtime records.
What changed across the 2026 release calendar
Models are grouped by their structured 2026 release month. Cohorts are model-weighted, not sales-weighted, and the final cohort includes June–July releases represented at the August 25 catalog cutoff. Grouping months into three release windows keeps the smallest monthly samples from driving the story.
Median MSRP fell across release cohorts
Median MSRP moves from $170 for Jan–Feb releases (41 models), to $162.5 for Mar–May (26), and $150 for Jun–Jul (33).
High stack persisted as premium share fell
High-stack models account for 31.7% of early releases, 38.5% of spring releases, and 42.4% of summer-to-date releases. Premium-price shares are 34.1%, 42.3%, and 21.2%, respectively.
Racing and trail releases were front-loaded
Racing-tagged shoes account for 22% of early releases, 7.7% of spring releases, and 15.2% of summer-to-date releases. Trail-surface shares are 29.3%, 11.5%, and 9.1%, respectively.
Catalog distributions
Each chart includes a visible plain-language interpretation and source note without repeating the same values in a second table.
Models by MSRP band
Of 100 models, 10 list below $120, 58 list from $120 to $179, and 32 list at $180 or more. Median MSRP is $160.
Models by listed men's weight
Of 100 models, 18 list under 8 oz, 51 list from 8 through 9.9 oz, and 31 list at 10 oz or more. Median listed men's weight is 9.45 oz.
Models by heel-stack band
Of 100 models, 5 list under 30 mm, 58 list 30–39.9 mm, 36 list 40–49.9 mm, and 1 list 50 mm or more at the heel. Median heel stack is 38 mm.
Models by heel-to-toe drop
The catalog contains 6 zero-drop models, 9 from 1–4 mm, 32 from 4.5–7.5 mm, 41 at exactly 8 mm, and 12 above 8 mm.
Models carrying each category tag
Models by catalog surface
75 models are road, 18 are trail, and 7 are mixed-surface.
Field completeness before analysis
9 of 11 evaluated fields meet this report's 100% structured-completeness rule. Outsole material and model generation do not, so this report makes no trend claim for either.
| Field | Complete | Analysis status | Note |
|---|---|---|---|
| Release month | 100/100 (100%) | Included | Structured YYYY-MM release month. |
| Editorial categories | 100/100 (100%) | Included | Multi-label categories; percentages do not sum to 100%. |
| Surface | 100/100 (100%) | Included | Road, trail, or mixed catalog classification. |
| MSRP | 100/100 (100%) | Included | Catalog list price in USD, not an observed transaction price. |
| Men's weight | 100/100 (100%) | Included | Ounces; source sample size and normalization can vary. |
| Women's weight | 100/100 (100%) | Included | Ounces; some values are normalized when only one gender is published. |
| Heel stack | 100/100 (100%) | Included | Millimeters under the heel using the catalog source convention. |
| Forefoot stack | 100/100 (100%) | Included | Millimeters under the forefoot using the catalog source convention. |
| Heel-to-toe drop | 100/100 (100%) | Included | Millimeter difference between catalog heel and forefoot values. |
| Structured outsole material | 0/100 (0%) | Not analyzed | Not represented in the runtime schema; no outsole trend is claimed. |
| Structured model generation | 0/100 (0%) | Not analyzed | Model names are not parsed into generations without a structured field. |
Methodology
Releases represented in the runtime 2026 catalog from 2026-01-01 through the cutoff. Colorway-only releases, spikes, hiking shoes, and announced models without public US availability are excluded.
Source hierarchy
- Exact-model manufacturer specifications and release documentation.
- Standardized independent measurements when the manufacturer omits a required field.
- Authorized retailer details when higher-priority sources omit a catalog fact.
- Release-calendar and trade-event sources for discovery cross-checking, not as a substitute for exact-model specifications.
Normalization
Weights follow the runtime catalog's documented men's size 9 and women's size 8 convention where standardized measurements exist. When only one gender is published, the catalog may normalize the other required value; unisex values may repeat.
The broader research basis is documented in the editorial methodology.
Limitations
- This is a partial-year snapshot ending 2026-08-25, not a full-year release census.
- The curated catalog is not sales-weighted and cannot support market-share claims.
- MSRP is list price at the catalog cutoff, not a sale or transaction price.
- Weight and stack sources can use different sample sizes or measurement conventions; the report does not independently lab-test every model.
- Category tags overlap, so category percentages are not additive.
- Structured outsole and model-generation fields are absent and intentionally not inferred.
- The dataset does not establish fit, comfort, ride, durability, injury outcomes, or performance gains.
- There is no prior version with identical methods, so these are cross-sectional 2026 patterns rather than year-over-year changes.
- The report excludes commerce listings, referral/search-performance data, and proprietary user data.
Change log
2026-08-25 · v1.2
Revalidated all 100 source records, corrected the Adizero Adios Pro Evo 3 geometry, and regenerated every aggregate, cohort, and source hash.
2026-08-09 · v1.1
Added release-cohort trends for price, high-stack adoption, premium share, and specialist release timing; removed repeated chart data tables from the page.
2026-08-08 · v1
Initial public aggregate report generated from the 100-model runtime catalog. Row-level data release, reuse terms, named review, and outreach remain owner-gated.
This public report presents aggregate findings only. It does not provide a row-level download or reuse license, and it does not claim named expert review. Learn more in the 2026 running-shoe release index, browse the multi-year shoe release timeline, or explore the models in the running-shoe comparison graph. Route status: 200 and indexable.