Contents
Understanding Training Load: ATL, CTL, TSB Explained
Learn how to measure and manage training load using ATL, CTL, and TSB metrics. Understand the fitness-fatigue model for smarter training decisions.
Quick Hits
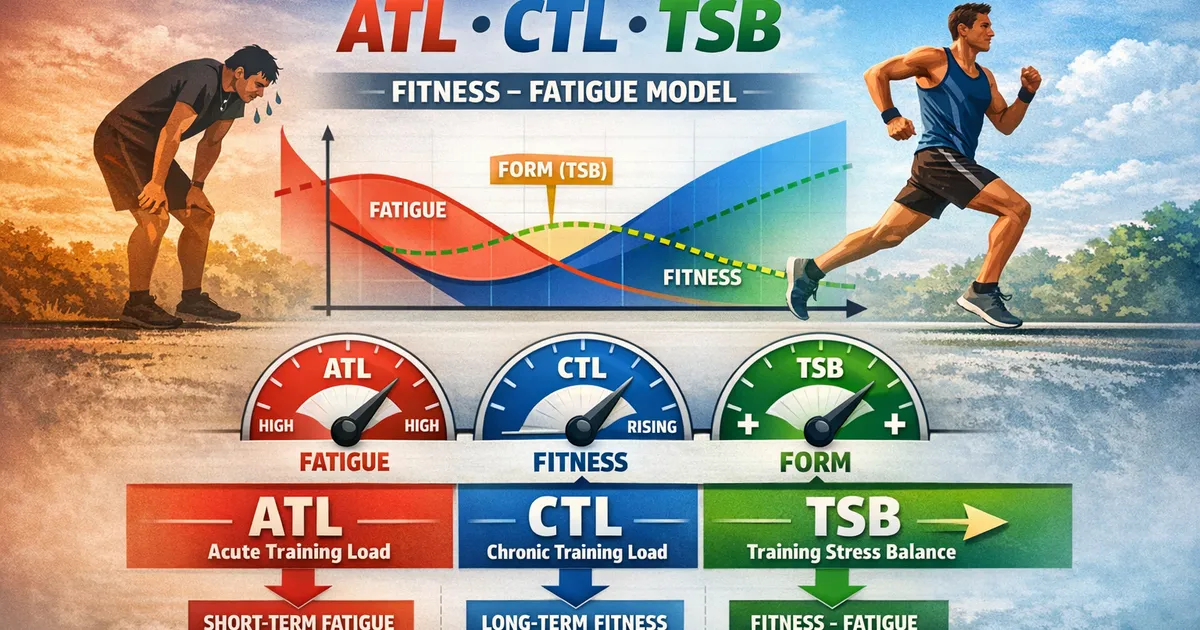
- •ATL (Acute Training Load) = recent training stress (fatigue)
- •CTL (Chronic Training Load) = long-term fitness
- •TSB (Training Stress Balance) = CTL minus ATL (form/freshness)
- •Positive TSB = fresh but potentially undertrained; Negative TSB = fatigued
- •These metrics help prevent overtraining and optimize race timing
Numbers don't lie—but you have to understand what they're saying.
Training load metrics help you answer: Am I training enough? Too much? Ready to race?
The Fitness-Fatigue Model
The Basic Concept
Training creates two responses:
- Fitness (positive training effect)
- Fatigue (negative, but temporary)
Your current "form" is fitness minus fatigue.
After a hard training block:
- High fitness + high fatigue = tired but fit
- Taper reduces fatigue faster than fitness decays
- Result: peak form for racing
Quantifying It
Training load metrics attempt to measure this:
- CTL = Chronic Training Load (fitness)
- ATL = Acute Training Load (fatigue)
- TSB = Training Stress Balance (form)
CTL: Chronic Training Load (Fitness)
What It Measures
CTL represents your accumulated fitness—the long-term average of your training stress.
Calculated as: ~42-day exponentially weighted average of daily training stress
Interpretation
| CTL Level | Meaning |
|---|---|
| Rising | Building fitness |
| Stable | Maintaining fitness |
| Falling | Losing fitness (detraining or taper) |
Guidelines
- CTL should rise gradually during build phases
- Rapid CTL increases risk overtraining
- CTL doesn't capture all fitness aspects (speed, economy, etc.)
ATL: Acute Training Load (Fatigue)
What It Measures
ATL represents recent training stress—short-term fatigue.
Calculated as: ~7-day exponentially weighted average of daily training stress
Interpretation
| ATL Level | Meaning |
|---|---|
| High | High recent stress (fatigued) |
| Low | Low recent stress (rested) |
| Higher than CTL | In a building phase |
| Lower than CTL | Tapering or undertraining |
Guidelines
- ATL responds quickly to training changes
- High ATL without recovery leads to overtraining
- ATL drops quickly during taper
TSB: Training Stress Balance (Form)
What It Measures
TSB = CTL - ATL
This represents your current "form"—how ready you are to perform.
Interpretation
| TSB Value | Meaning |
|---|---|
| Positive (+) | Fresh, recovered (fitness > fatigue) |
| Zero | Balanced |
| Negative (-) | Fatigued (fatigue > fitness) |
Race Day Targets
For racing at peak form:
- TSB of +5 to +25 is common target
- Too positive (>30) = undertrained
- Negative = still carrying fatigue
During training:
- Negative TSB is normal and necessary
- TSB of -10 to -30 during build phases
- Deeper than -30 risks overtraining
Practical Application
During Base Building
- CTL rising gradually (3-5 points per week max)
- ATL fluctuating with training load
- TSB slightly negative to moderately negative
During Build Phase
- CTL rising more aggressively
- ATL elevated
- TSB moderately negative (-10 to -30)
During Taper
- CTL stable or slightly declining
- ATL dropping rapidly
- TSB rising toward positive territory
Race Week
- CTL maintained by reduced but purposeful training
- ATL low from reduced volume
- TSB positive (target: +5 to +20)
Example Training Cycle
| Week | CTL | ATL | TSB | Phase |
|---|---|---|---|---|
| 1 | 50 | 55 | -5 | Build |
| 2 | 53 | 60 | -7 | Build |
| 3 | 56 | 65 | -9 | Build |
| 4 | 55 | 45 | +10 | Recovery |
| 5 | 58 | 62 | -4 | Build |
| 6 | 62 | 70 | -8 | Build |
| 7 | 65 | 75 | -10 | Peak |
| 8 | 64 | 50 | +14 | Taper |
| 9 | 62 | 40 | +22 | Race week |
Limitations
What These Metrics Miss
- Intensity specificity: All stress counts equally
- Life stress: Work, sleep, relationships affect recovery
- Individual variation: Same numbers mean different things
- Skill development: Running economy, form improvements
When to Ignore the Numbers
- If you feel terrible despite good TSB
- If you feel great despite negative TSB
- When metrics conflict with performance indicators
- During illness or unusual life circumstances
Listen to your body alongside the data.
Getting Started
Track Your Training
Use platforms that calculate these metrics:
- TrainingPeaks (industry standard)
- Strava (limited features)
- Garmin Connect
- Training analysis platforms
Establish Baselines
- What's your typical CTL when fit?
- What TSB range leaves you feeling good?
- How do your metrics correlate with performance?
Make Gradual Adjustments
Don't chase specific numbers immediately. Use metrics to:
- Prevent overtraining
- Time your taper appropriately
- Understand your personal patterns
Training load metrics add objectivity to training decisions. Use our Training Load Calculator to analyze your training, and track your fitness-fatigue balance on your dashboard.
Key Takeaway
Training load metrics like ATL, CTL, and TSB provide objective data to guide training decisions. They help you train hard enough to improve while avoiding overtraining, and time your peak fitness for key races.
Frequently Asked Questions
What's a good CTL for marathoners?
How negative should TSB be during training?
Why is my TSB negative but I feel fine?
References
- TrainingPeaks methodology
- Fitness-fatigue model research